Distributed Tracing
The term microservice means different things to many different people. Some, including myself, might call it freedom from the oppressive monolith and chains that must be bore when working on one. Allowing developers to spread there wings and fly, without having to worry if the changes they made broke some obscure part of the codebase. Enabling the release of code early and often, shedding the fear going to production and delivering code that matters.
This does not mean that the monolithic architecture is inherently bad. For instance, if one is working on a small project, it is probably not worth the overhead of maintaining many services, through out their lifecycle. That would be like bringing a grenade launcher to hunt deer. Sure it gets the job done, but it is expensive and there is a high probability that it might blow up in your face. Plus, as far as I am aware, deer do not shoot back.
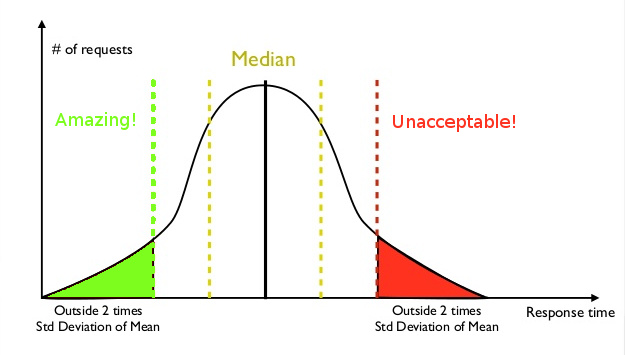
One of the things that has a high probably of blow-back is, tail-latency. Latency can be defined as the time it takes for something to respond to an action or event. Such as the time it takes for chemical reactions to take place, the length in time it takes a double-clutch to register a change of gears, or how long it takes for a website to respond when a button is clicked. Tail-latency is the classification of the reactions that took longest to occur. Being the far right-end of the bell-curve of response times.
Let us say that we are have developed an application that provides users will silly cat pictures. It normally takes the application 100 milliseconds(ms) to load a single image an amusing kitty photo. Each page consists of an average aggregation of ten photos. It is known that the is a 10% chance of having an image take 1000ms or 1 second to load. Meaning that a complete page has a high probability of taking one second to completely load up. This one second lag is what we would call our tail-latency. Sure it normally takes 100ms to run, but it is the 1 second that really matters.
Bad news, people are fickle and tend to only see bad things. Meaning that if your app responds really fast 3 times, but is slow for the fourth. All the users will really notice is the slow response.
Take for instance, let’s say you visit a sandwich shop. The first time you order a chicken sandwich on rye, it was good. The next next you go, you order the chicken sandwich again, since knowing that it was pretty good. Turns out this sandwich was good as well. However, on the third visit, we have the chicken sandwich again, but this time something awful happens. After consuming the tasty morsel, later that evening you catch the stomach virus going around work. You spend the rest of the night with traumatizing stomach pains, leading up to the eventual evacuation of the sandwich had for lunch. The experience was so awful, that it ruined chicken sandwiches for you entirely. Now it really was not the sandwiches fault that you got sick, but even thinking about eating another is out of the question. How’s the saying go? It only takes one bad apple to ruin the bunch?
Having to wait one whole second to look at funny pictures might not seem up to par with total gastro-evacuation, but it might cause loss of users. Sure the first time, they might just chalk it up to just Comcast for providing third world internet connection speed. However, blaming a slow ISP for inhibiting a quality experience of funny cat photos can go only so far . If the website in continuously slow, people will give up and search for a better alternative. To them, it may is not worth having to wait internet eons to get what they want, and people will move on.
So what does this have to do with distributed tracing? Well as it turns out, a whole bunch! Distributed tracing allows for an in-depth break down of a latency tree in a micro-service architecture. Essentally, a profiler, such as yourkit, for the cloud. It enables a more granular break down a service call. It shows all of the interactions of the all the dependent services of a trace and how long each interaction takes. Painting a more clear picture of a transaction. Hopefully, leading to a paths where optimizations can be wired in to reduce response times.
The rest of the post references a sample project in this repository:
https://github.com/Unthrottled/distributed-tracing
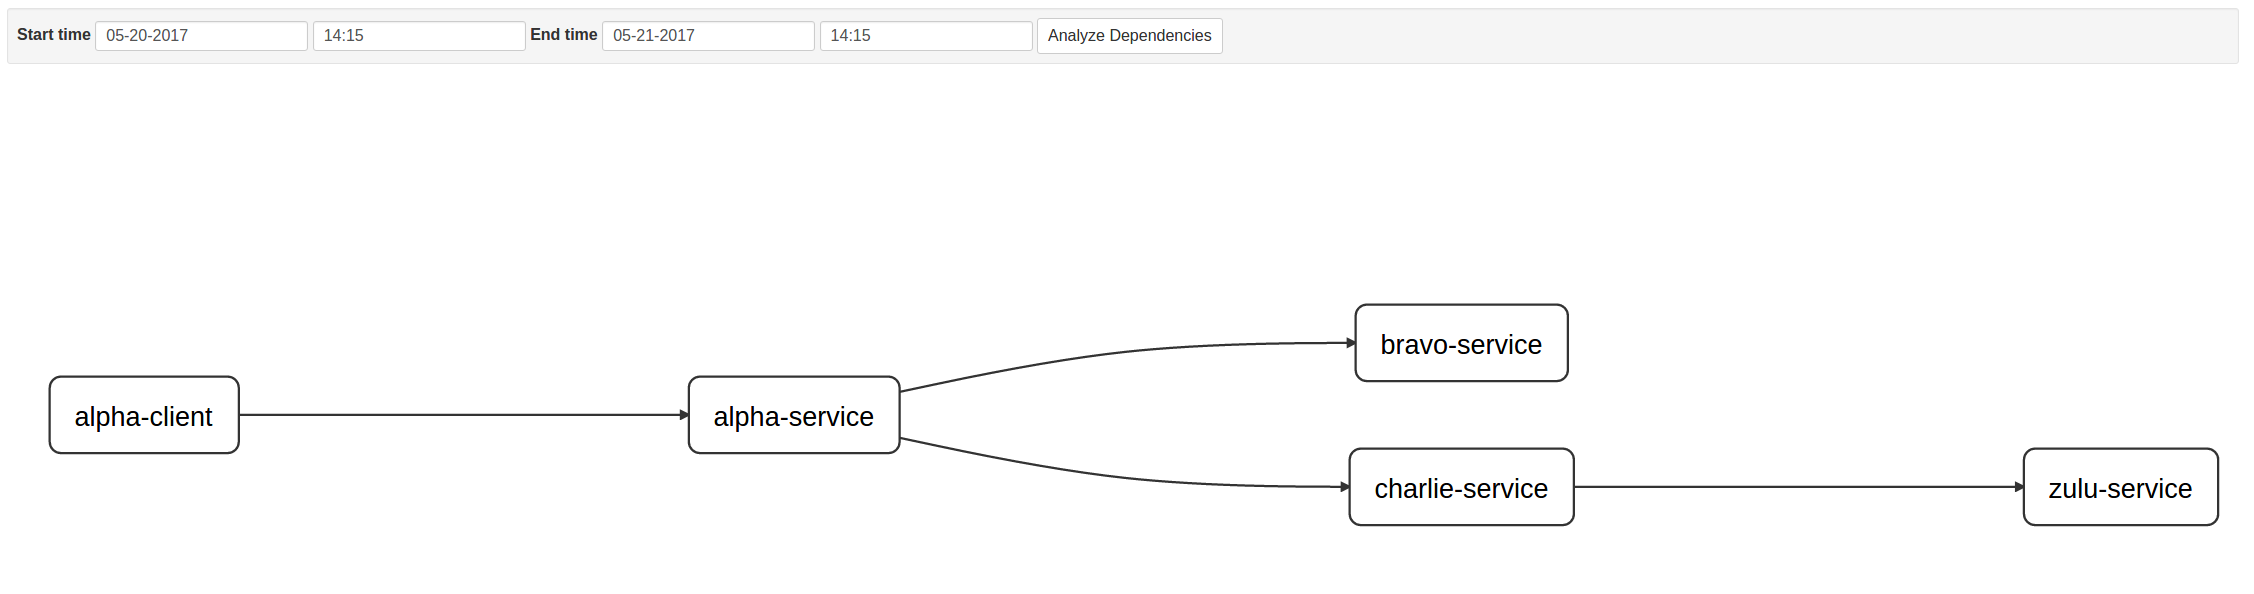
Continuing off of the previous example: we have an Alpha Service. Alpha Service has a dependencies on both Bravo Service and Charlie Service. Charlie Service has a dependency Zulu Service. We know that it takes around 100ms (with the occasional tail latency of 1000ms), but do not know the break down of time spent with dependent interacting with one another. For instance, it might be the case that Alpha, Bravo, and Charlie all respond in a reasonable amount of time of lets say 10ms. It might be Zulu that takes an average of 70ms, with a chance of being bogged down and taking 930ms.
This currently is all conjecture at the moment, just a bunch of guesses. There exits many cool tools and methodologies that allow for this kind of insight in place of, “well it could be this”. Knowing is way better than guessing!
One such technology is Twitter’s Zipkin which is based off of Google’s research, on tracing distributed infrastructure, Dapper paper. Now I have not read the entire paper as of yet. However, I am able to give you a synopsis of what I know, base off of use of Zipkin and presintations on such a subject.
Starting off with the definition of a Span in the context of Client-Server. A Span is really any unit of work that a Client or Service will execute in. In the case of Zipkin it can be any of the following.
- It first starts at the point of the client sending a message to a server (Client Send:CS).
- The next event is when the server eventually receives the client’s sent message (Server Receive:SR).
- After that, the serve will eventually send a message back to the client which initiated the request (Server Send:SS).
- Ending the span when the client receives (CR) the message from the server it contacted (Client Receive:CR).
A Trace is a tree of spans that compose an entry point request into the infrastructure we happen to be debugging. Given the example stated above and all requests are blocking, a trace would be:
- Alpha Client sends a message to Alpha Service. CS
- Alpha Service receives the message from Alpha Client. SR
- Alpha Service sends a message to Bravo Service. CS
- Bravo Service receives the message from Alpha Service. SR
- Bravo Service sends a message back to Alpha Service. SS
- Alpha Service receives the message from Bravo Service. CR
- Alpha Service sends a message to Charlie Service. CS
- Charlie Service a receives the message from Alpha Service. SR
- Charlie Service sends a message to Zulu service. CS
- Zulu Service receives the message from Charlie Service. SR
- Zulu Service sends a message back to Charlie Service. SS
- Charlie Service receives the message from Zulu Service. CR
- Charlie Service sends a message back to Alpha Service. SS
- Alpha Service receives the message from Charlie Service CR
- Alpha Service sends a message to Alpha Client. SS
- Alpha Client receives the message from Alpha Service. CR
That is quite a bit to take in, fortunately with this information, Zipkin has the ability to create a graphical depiction of a dependency tree! The following dependency tree was created by Zipkin UI from a trace of the example project above.
Here is an example of the trace of this example project.
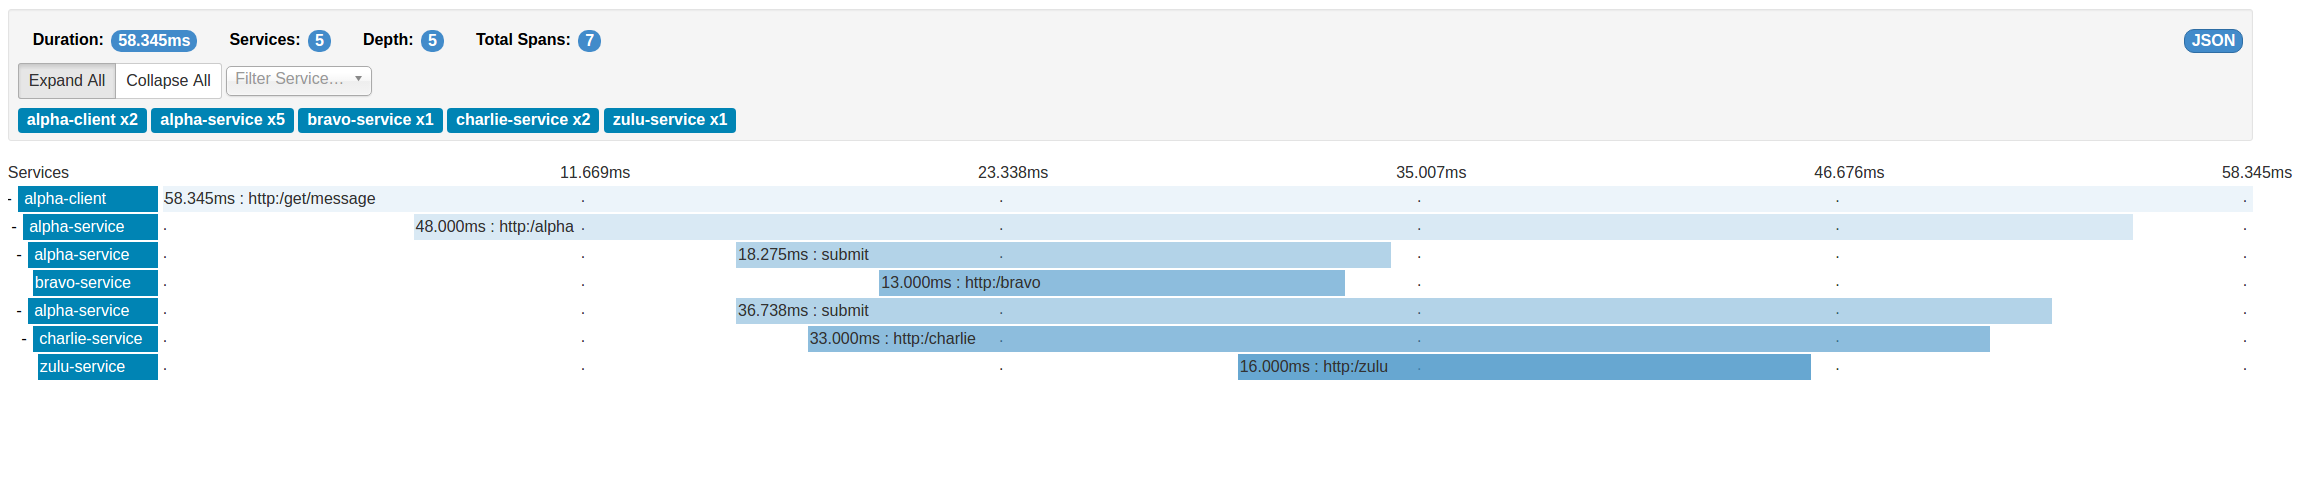
There may appear to be a discrepancy between the image and list of dependencies above. Zipkin states that there are only seven spans within the current depicted trace. The dependency tree gives us only five nodes, so there should really only be five, something does not add up right?
Fun fact! Take this excerpt from Spring cloud docs:
If you annotate your method with @Async then we’ll automatically create a new Span with the following characteristics:

    · the Span name will be the annotated method name

    · the Span will be tagged with that method’s class name and the method name too
That is exactly what I did, I created a method that would allow the asynchronous invocation of REST calls to both Bravo and Charlie service. Preventing the need to wait for one service to respond before communicating with the next.
I would highly recommend checking out the documentation to Spring Cloud Sleuth, linked above. It is vastly more robust that this blog post, which is supposed to be more of a 10000 foot overview!
One of the great things about Zipkin is that it paints a really clear picture of what is happening in your system. Allowing you to stand back and think, “That’s funny, why is it doing that?”
I have a really good example of that, because I had that moment creating the example project for this blog post! My issue was that I was getting the kind of trace below.
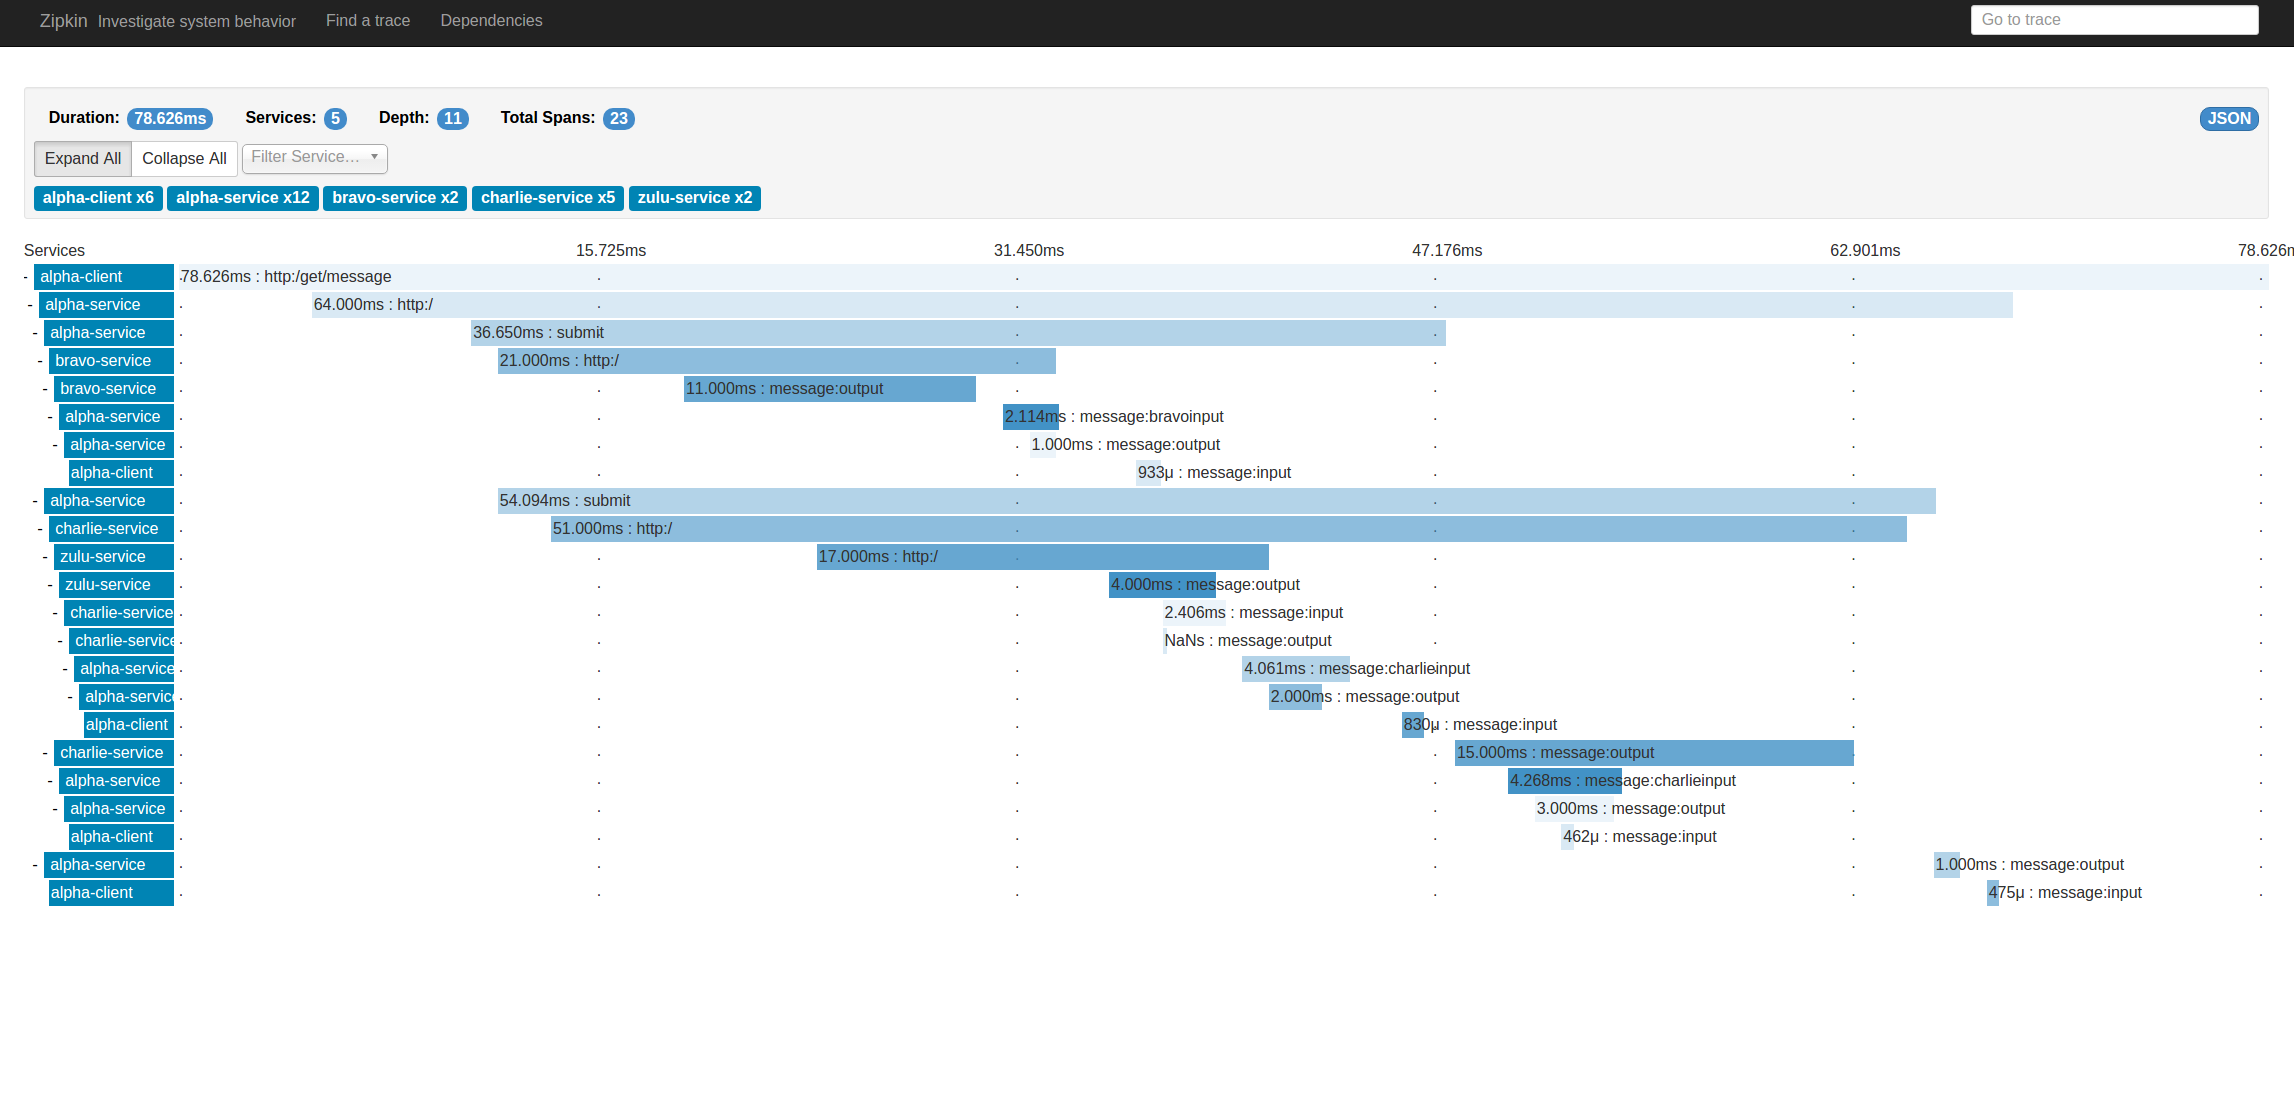
I was wondering why does it not look like the previous trace in this post. The trace had all the things that I wanted; however, I was also getting a lot more than expected. Turns out extra smaller bits between Bravo and Charlie, which cascade back to Alpha client, were the streams I created. You do not actually need to use Streams for spring cloud sleuth stream to log spans to a Zipkin server. Sleuth has a large list of things that it creates spans for without needing to actually use streams. So it is sufficient to have the Sleuth Stream Dependency without actually using streams. Spring will automatically be configure to bind to the stream that the ZipkinStreamEnabledServer creates. Allowing spans to be sent over to Zipkin and traces to be viewed in the Zipkin UI.
So I had to rid myself of using using the really cool streams, in the name of clearer more concise traces. Fortunately, I saved the code using streams as a branch called “SERVICE_STREAMS” on the example repository! It shows an example of how to have more than one stream bound to an Spring boot application.
Anyways, I hope that this shows how one can debug/optimize or even start looking into the right direction when dealing with distributed systems.
Be sure to visit the project repository!
https://github.com/Unthrottled/distributed-tracing
Here are all the things (I have not mentioned) which I found really helpful in creating this post!
-https://spring.io/blog/2016/02/15/distributed-tracing-with-spring-cloud-sleuth-and-spring-cloud-zipkin -https://spring.io/guides/gs/service-registration-and-discovery/ -http://docs.spring.io/spring-cloud-stream/docs/current/reference/htmlsingle/